
Faking browsers is easy — but not at scale
131,819 residential US IPs threw 1.4M brute-force attempts at one mobile-only customer in 30 days — all collapsing onto a handful of fingerprints.

One of our customers runs a mobile-only product. Their users authenticate from iOS and Android apps and that is the only way to use the service. So when we started seeing Chrome on Windows showing up against their endpoint at six-figure daily volume, we knew the whole stream was automated. Over the last 30 days we logged 1,476,767 attack requests against this single customer, riding 131,819 distinct residential IP addresses.
This post is a quick look at what those requests actually looked like once we had them all in one place, and what the shape of a modern account-takeover campaign tells us about how attackers are spending money these days. We've also published the full IP list as a free download for anyone who wants to feed it into their own blocklists or research.
Renting tens of thousands of residential IPs has become cheap. Renting tens of thousands of genuinely different browser environments has not. That gap is the thing that gives attackers like this away.
The shape of the wave
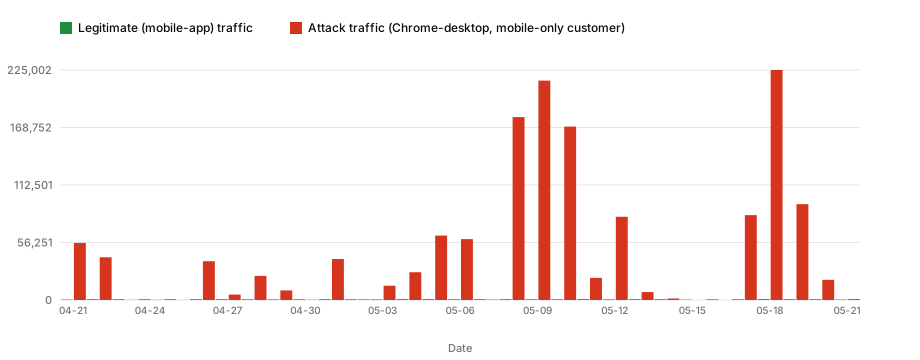
Because the customer's real users come only from native mobile apps, the heuristic for separating attack from legitimate is unusually clean: is the request Chrome on Windows? If yes, automated. We ran that filter over 30 days of the powcaptchas collection and got this:
| Traffic | 30-day volume |
|---|---|
| Legitimate mobile-app requests | 20,933 |
| Attack requests (Chrome on Windows) | 1,476,767 |
| Distinct attacker IP addresses | 131,819 |
| Peak attack day (2026-05-18, 24 hours) | 225,002 |
The attack outweighed legitimate traffic by roughly 70 to 1. Long quiet days, then weekend-sized spikes that pushed past 200,000 requests on a single day, with four separate days above 150,000.
Where the IPs came from
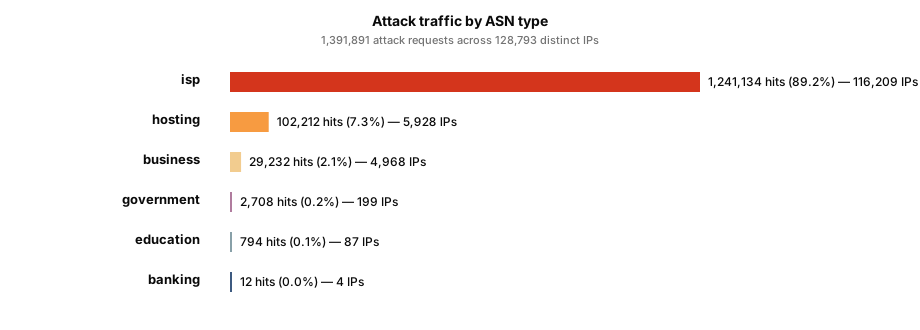
The interesting question for us was who the attacker was paying for those 131,819 IPs. We pulled the full IP list out of the database, fed it into our own local ipinfo service, and aggregated by ASN, country, and IP type. Out of the 128,793 IPv4 addresses we could resolve, the picture was very consistent:
| Category | IPs | Hits | Share of attack |
|---|---|---|---|
| Residential / mobile ISP | 117,141 | 1,244,632 | 89.4% |
| Datacenter | 8,695 | 118,176 | 8.5% |
| VPN | 7,574 | 103,364 | 7.4% |
| Public proxy | 3,710 | 33,586 | 2.4% |
| Known abuser networks | 7,249 | 62,046 | 4.5% |
| Tor | 0 | 0 | 0 |
Categories overlap (an IP can be both VPN and abuser), but the headline is clear enough: about nine in ten requests arrive from real broadband customers' IP addresses. The attacker is paying for a residential proxy pool rather than spinning up cheap datacenter exits. Pools at this scale go for several thousand dollars a month, so this is a meaningful capital outlay.
The other striking number is the geography. 125,202 of 128,793 distinct attacker IPs (97.2%) geolocated to the United States. Everything else is a long tail of Canada, the UK, the Caribbean, a smattering of South American and European IPs. This is a US-focused operation buying a US-shaped proxy footprint.
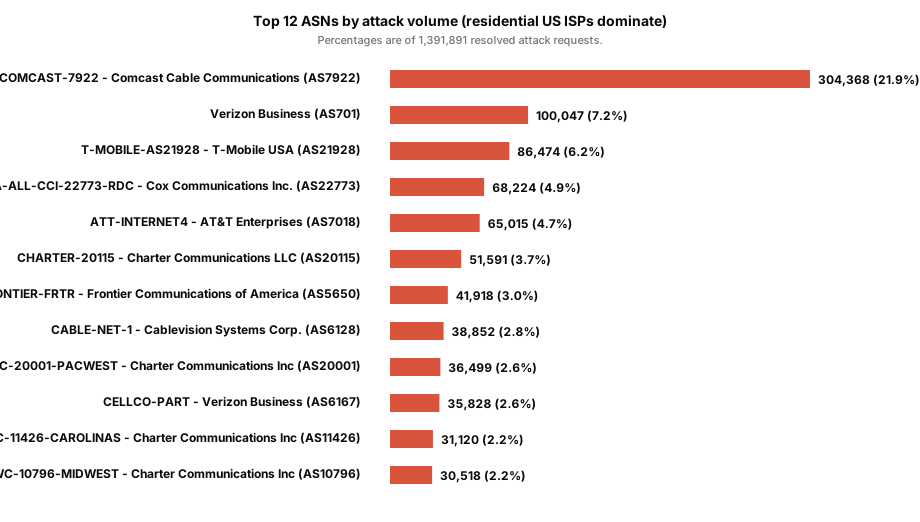
When you break out the top ASNs the operator has clearly bought wide coverage of every major US broadband and mobile carrier:
| Rank | ASN | Network | Attack hits | Share |
|---|---|---|---|---|
| 1 | AS7922 | Comcast (US) | 304,368 | 21.9% |
| 2 | AS701 | Verizon Business / UUNET (US) | 100,047 | 7.2% |
| 3 | AS21928 | T-Mobile US | 86,474 | 6.2% |
| 4 | AS22773 | Cox Communications (US) | 68,224 | 4.9% |
| 5 | AS7018 | AT&T (US) | 65,015 | 4.7% |
| 6 | AS20115 | Charter Communications (US) | 51,591 | 3.7% |
| 7 | AS5650 | Frontier (US) | 41,918 | 3.0% |
| 8 | AS6128 | Cablevision / Optimum (US) | 38,852 | 2.8% |
| 9 | AS20001 | Charter (TWC PacWest, US) | 36,499 | 2.6% |
| 10 | AS6167 | Verizon Cellco (US) | 35,828 | 2.6% |
The implication for anyone hoping to defend with a reputation blocklist is uncomfortable. A list that blocks datacenters, known VPNs, and Tor stops less than 11% of this campaign by volume. The rest are real Comcast and T-Mobile customers - or rather, machines exiting through them, which from the network's perspective is the same thing. You cannot block Comcast.
If you would like to use the list for your own research, the full IPv4 list is here:
attack-ip-list.txt- 128,793 IPs, one per lineattack-ip-list-with-counts.csv- the same list with per-IP hit counts
You can't fake what you can't see
If reputation lists are mostly off the table, the question is what else gives the attacker away. Every HTTPS request carries quite a lot of information beyond the URL and the headers a developer typically thinks about:
- TLS ClientHello / JA4 - the order of cipher suites, the supported extensions, ALPN, signature algorithms. Real Chrome on Windows emits a measurably different ClientHello to Firefox, to a Go HTTP client, to curl-impersonate, or to a headless Chromium with a non-default config. JA4 is a canonical hash of that.
- Request header shape - not just what headers are sent, but which ones are sent and in what order. Real Chrome on Windows sends
sec-ch-ua,sec-ch-ua-mobile,sec-ch-ua-platform,priorityand so on. A program that pretends to be Chrome generally does not. - Accept-Language - real humans living in different places carry different distributions of locales and quality-factor lists. Automated traffic carries one.
- sec-ch-ua-platform - trivial to lie about on its own, but the lie is only useful if it stays consistent with all the other signals.
Faking any of these for a single request is easy. The harder problem for the attacker is making each one of their tens of thousands of containers look genuinely different from the next - different TLS stack, different header ordering, different locale, a UA that matches the platform header, a platform header that matches the JA4, and so on across every dimension at once. We see plenty of campaigns where the attacker has worked hard on a single forged request and then deployed that same exact request from 50,000 IPs.
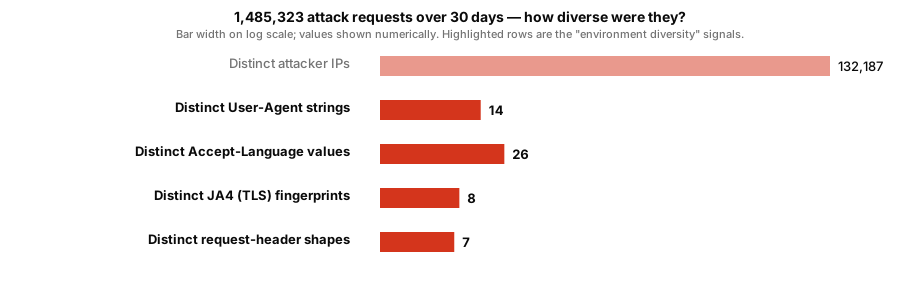
This campaign is one of those. Here's what 1,476,767 attack requests look like when you ask "how many distinct values do we see for each signal?":
| Signal across the 1.4M attack requests | Distinct values |
|---|---|
| Distinct attacker IP addresses | 131,819 |
| User-Agent strings | 14 |
| Accept-Language values | 26 |
| JA4 TLS fingerprints | 8 |
sec-ch-ua-platform values | 1 |
| Full request-header shapes | 7 |
One JA4 fingerprint covers 98.4% of all attack TLS handshakes and rides 130,991 of the 131,819 IPs. Three User-Agent strings (Chrome 146, 147 and 148 on Win64) account for 99.7% of attack requests. The 130,000 residential IPs are wearing the same handful of outfits.
Detecting the User-Agent in JavaScript, and why it isn't enough
The first move most developers reach for is client-side JavaScript that reads navigator.userAgent and looks for known automation markers: HeadlessChrome, PhantomJS, Selenium, or newer strings from agentic browsers like ChatGPT Atlas and Perplexity Comet. Something like:
const ua = navigator.userAgent.toLowerCase();
const looksAutomated = /headless|phantom|selenium|puppeteer|playwright/.test(ua);
That will catch a naive script that forgot to override its User-Agent. It will not catch anyone who paid attention. navigator.userAgent is a plain string the running JavaScript environment reports about itself, and anti-detect browsers strip or rewrite it at compile time. Puppeteer and Playwright both accept a --user-agent flag. Even curl-impersonate sets it to whatever you want. Trusting the User-Agent alone means trusting the bot to identify itself.
The useful move is to compare navigator.userAgent against signals that the browser can't easily change without breaking. Some examples:
- User-Agent Client Hints mismatch. Chrome sends
sec-ch-ua,sec-ch-ua-mobileandsec-ch-ua-platformindependently of the User-Agent header. A bot that lies about its User-Agent but forgets to update the client hints is caught on the disagreement. navigator.userAgentData.getHighEntropyValues()returns platform, architecture and bitness fields that must agree with the User-Agent string. Real Chrome on macOS ARM reports"macOS"and"arm". A bot claiming Chrome on Windows while running on a Linux headless build gets caught here.- Feature detection. If the User-Agent claims Safari 17 but
navigator.gpuis available (which Safari doesn't implement), the claim is a lie. There are dozens of these tiny disagreements between what a User-Agent claims and what the browser actually implements. - TLS fingerprint. A JavaScript User-Agent check happens after TLS has already completed. The JA4 hash of the ClientHello is set by the underlying network stack, not the JavaScript runtime, and it can't be rewritten from inside the page. Real Chrome on Windows produces one JA4; a Go HTTP client pretending to be Chrome produces a different one.
None of these are complete on their own. Combined, they defeat almost every off-the-shelf headless setup and cost serious money to defeat at scale. That's exactly the pattern the 131,000-IP campaign above walked into: real residential IPs, plausible User-Agent strings, but eight TLS fingerprints doing the work of thousands.
The short version: if you're writing JavaScript to detect bot user-agents, treat navigator.userAgent as one input of ten, not as the answer. And read the network-layer signals from the server side, where the bot has no chance to lie to you.
What real traffic looks like
You might suspect that low diversity is normal for this customer. Maybe everyone using the service happens to run one phone in one locale and that's just the shape of the userbase. It isn't. In the same 30-day window the legitimate mobile-app traffic carries far more environmental variety:
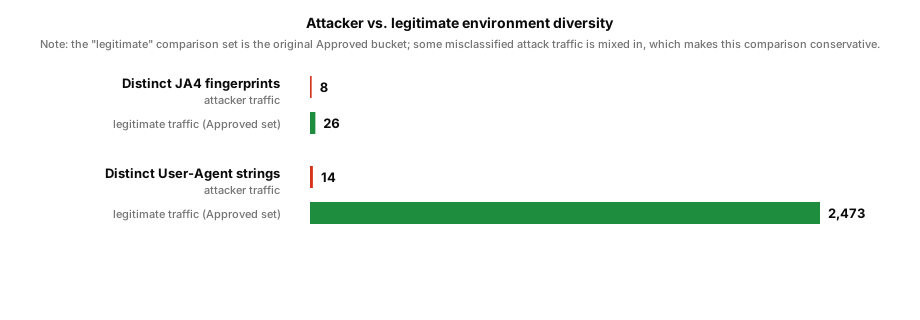
| Signal | Attacker | Legitimate (Approved set) |
|---|---|---|
| Distinct JA4 | 8 | 26 |
| Distinct User-Agent | 14 | 2,473 |
Real users are running iOS 17, 18 and 26 across half a dozen iPhone generations, Android on every OEM under the sun, WebViews from social apps, the occasional desktop visit, Brave / Safari / Firefox here and there. The attacker is running three Chrome-on-Windows User-Agents on top of one TLS stack.
Why this is expensive to fix from the attacker's side
You might be wondering why the attacker doesn't simply rotate more fingerprints. There's a real cost asymmetry here that's worth spelling out.
- Residential proxy bandwidth runs at roughly $1-$10 per GB. 131,000 IPs delivering 1.4M small requests is a few thousand dollars of traffic. That's already what the attacker is paying.
- A real, distinct browser environment - one that holds together across TLS, headers, locale, behavioural fingerprint, and hardware signals - is much more expensive to provision. The commercial route runs through anti-detect browsers like Kameleo, Multilogin, Undetectable and GoLogin, which distribute source-patched Chromium builds with the JS-visible tells removed at compile time - and even then, the profiles have to sit on real hosts to hold up under signals Chromium can't lie about at the C++ layer (we come back to those in the next section). Either you compromise actual end-user devices (malware) or you orchestrate full Chromium instances with real GPU drivers, fonts, timezones, audio stacks, randomised hardware fingerprints, and per-instance OS configuration. The container approach typically costs $30-$100 per machine per month for the kind of fleet that produces convincing diversity. Even 5,000 of those is a serious budget. 131,000 of them is not in the same universe as the proxy bill.
- Open-source tooling like
curl-impersonateand stock HTTP libraries is free, but each one emits a small, fixed set of TLS fingerprints. We can't tell from a single hash which library is in use, but a giant residential pool collapsed onto one fingerprint is what you'd expect from this class of tool, not from a real browser fleet.
So the attacker faces a choice between cheap IPs with poor environment diversity, or rich environment diversity that costs orders of magnitude more to run. The campaign we're looking at has clearly picked the first option.
Even patched Chromium leaves fingerprints
The campaign we watched cut corners. A serious operator wouldn't - and the state of the art on the attacker side is worth naming, because it changes where the detection layer has to live.
The 2021 generation of bot tooling worked at the JavaScript layer. puppeteer-stealth, undetected-chromedriver and their descendants ran on stock Chrome and monkey-patched the browser at runtime to hide the tells: navigator.webdriver set to false, the CDP runtime methods trapped, property-enumeration order corrected, and so on. That generation is effectively over. Detection at the JS layer caught up, and every stealth patch was measurable as the absence of the thing you'd expect to be there.
The 2026 generation doesn't monkey-patch. It rebuilds. Commercial anti-detect browsers - Kameleo, Multilogin, Undetectable, GoLogin - distribute builds of Chromium that have been patched at the C++ source level and recompiled. Every navigator.webdriver, every CDP hook, every property-enumeration tell is stripped before the binary is compiled. Once that binary is running, there is no runtime monkey-patch to detect, because there is no lie to catch in the act. The lie is baked into the browser.
That defeats every anti-bot technique living above the JavaScript surface, where most of the industry still operates. It's why the "detect headless Chrome" pitch you'll still hear at conferences no longer describes a real defence against anyone who's paying attention.
The ground truth doesn't live above the JS surface any more. It lives below it, in signals a source-patched browser can't cheaply lie about because they're anchored in real hardware or the network stack:
- SIMD instruction timing. A patched Chromium can rewrite
navigator.hardwareConcurrencyin one line of C++. It can't fake how long a WebAssembly SIMD op takes to execute on the underlying core. Real end-user devices produce a tight distribution of timings for the same op; virtualised bot fleets sitting on shared silicon produce a different distribution, and one that shifts with host load in a way real hardware doesn't. Our SDK collects SIMD readings on every session for exactly this reason. - DNS resolution path. Anti-detect browsers route TCP through a residential proxy. But the browser's DNS lookups frequently still resolve through the host machine's stub resolver, or through a public resolver like
1.1.1.1configured on the operator's VPS. The mismatch between where DNS resolves and where the TCP connection terminates is a durable tell that the "user" and the "IP" are not the same machine. - TLS handshake microtiming. JA4 captures the shape of a ClientHello. It doesn't capture how long the handshake takes to complete, or how the timing correlates across thousands of sessions from the same proxy pool. Bot fleets running through a shared exit produce correlated microtiming across sessions that real users, on independent home networks with independent RTTs, do not.
- IP-rotation cadence versus session state. Anti-detect browsers rotate the exit IP for each session. Real browsers don't. When a "returning user" arrives on a fresh IP with no TLS session ticket and no cached HSTS state, and does that ten thousand times a day across a residential pool, the aggregate pattern is easy to see even when every individual session looks perfectly formed.
None of these signals cost the attacker anything to emit. They cost real money to fake consistently. Genuine hardware diversity requires actual silicon. Genuine DNS-path consistency requires the browser and the proxy to live on the same machine. Uncorrelated TLS microtiming requires uncorrelated network paths. Each one closes off a class of cheap evasion and pushes the attacker toward infrastructure that can't be rented by the hour.
The campaign we opened this post with - 131,000 IPs collapsing onto 8 JA4s - is instructive even for defenders who never see attackers that unsophisticated. The economics gap is the same at the top of the market as it is at the bottom. Only the layer changes. Close off the JS-layer tells and the attacker starts collapsing fingerprints below the JS layer instead. The signal moves; it doesn't disappear.
How we caught them
We don't write a hand-crafted rule per attacker. Our detection pipeline ingests the fingerprint signals above and learns the signatures of malicious clusters automatically, and once a cluster is identified it's blocked at the access policy layer before our CAPTCHA is even served. For this campaign that means almost a million attack requests have been intercepted by the time the rule we're describing learned what to look for, with many more sitting blocked in the day-by-day chart above.
Concretely, for every blocked attempt:
- The attacker paid residential proxy bandwidth for a request that never reached the challenge.
- The customer's application never saw the request either - we intercepted it before it left our edge.
- Our cost-per-blocked-attempt is a single classifier evaluation. The attacker's cost-per-blocked-attempt is their proxy bandwidth plus their list-management overhead.
We're not naive enough to think attackers can't adapt. They can, and they will. But every adaptation costs them something, and the longer the campaign runs, the more obvious the residue becomes. The point of publishing the specifics here, IP list and all, is to make the next adaptation just a little bit more expensive.
What this tells you about your own traffic
If you run an auth, signup, payment, or account-recovery endpoint at any meaningful scale, you are very likely seeing campaigns shaped like this whether you can see them or not. The shape is consistent across the dozens we've watched this year:
- A large residential proxy pool, often hundreds of thousands of IPs strong, spread across every major consumer ISP in the target country.
- A short list of fake credentials or stolen identities being cycled through it.
- A very small set of TLS, header and User-Agent fingerprints riding underneath all of it.
- Bursty activity - long quiet days punctuated by weekend spikes.
Rate-limiting by IP catches a fraction. Blocklisting proxy and VPN ranges catches single-digit percentages on top. JS-layer detection catches the previous generation of stealth libraries and misses the current one. What works against a campaign of this shape - and against the next tier of operator running source-patched Chromium - is the layer the attacker can't cheaply diversify: TLS stack and handshake microtiming, DNS resolution path, hardware timing signals like SIMD, header shape, and behavioural fingerprint.
That's the layer Prosopo's bot detection operates on, and it's the layer we'll keep publishing about as new campaigns come through. If you'd like a second pair of eyes on your own login traffic, get in touch.
Related Posts to Faking browsers is easy — but not at scale
How to deploy Procaptcha on your website or app
Wed, 20 Sept 2023

TypeScript: Mapped Type Magic 🪄
Wed, 13 Mar 2024

Vite: How to handle `.node` files
Mon, 08 Apr 2024

Using Vite To Rebuild Local Dependencies in an NPM Workspace
Thu, 18 Apr 2024
TypeScript: Branded Types 🔧
Mon, 22 Apr 2024

actions/cache@v3 restore: GitHub Actions Cache Fix
Tue, 18 Jun 2024
tsx vs ts-node: Time to Drop ts-node for tsx
Wed, 26 Jun 2024
How to Test Your Ansible Playbooks Locally
Tue, 30 Jul 2024

Monorepo vs Multirepo Architecture: How to Decide?
Thu, 01 May 2025

Mastering Versioning: A Guide to Software Stability
Fri, 02 May 2025

Independent vs Locked Versioning in a Workspace
Sat, 03 May 2025

Streamlining Releases: Building Scalable CICD Pipelines with Changesets
Tue, 06 May 2025

PHP Views Package - Templating Made Easy with Blade and Model-Driven Approach
Mon, 19 May 2025
Reactive Frameworks Cheatsheet - React, Vue, Svelte and Angular
Mon, 19 May 2025

We cut our Mongo DB costs by 90% by moving to Hetzner
Wed, 12 Nov 2025

We suffered MongooseJS so you don't have to
Tue, 02 Dec 2025

How to Add CAPTCHA to Fastly CDN
Tue, 20 Jan 2026

How to Stop PHP Form Spam (Without a Plugin)
Wed, 24 Jun 2026
Why Am I Clicking Traffic Lights? The reCAPTCHA CAPTCHA Explained
Fri, 15 Mar 2024

How to Integrate CAPTCHA Without Violating User Rights
Sat, 12 Apr 2025
Procaptcha vs Friendly Captcha - Why Real Bot Protection Matters in 2026
Wed, 13 Aug 2025
Why is Ticket Scalping so Hard to Stop? Uncovered
Sat, 15 Mar 2025
🎫 Preventing Ticket Bots - The Battle for Fair Access
Sun, 02 Nov 2025
How to Stop Ticket Scalping: The 2026 Anti-Bot Playbook
Mon, 29 Jun 2026
Why Do Bots Fill Out Forms? The Economics of Form Spam and How to Stop It
Thu, 01 Oct 2026